Imagine two investors who both bought TQQQ. The first bought in February 2010, the month it launched, and held for 16 years. By late May 2026, their $10,000 had grown to over $3.95 million - a nominal total return of +39,526%, compounding at 44.38% per year. The second investor bought in January 2000, a year before TQQQ existed - but had they been able to, based on what the Nasdaq did from that peak, their position would still be deeply underwater today. The Nasdaq fell 83% over 30 months following the dot-com peak. A simulated 3x leveraged version of that crash would have approached a total wipeout, and the recovery path from that entry point has never fully closed the gap with an unlevered QQQ position.
Same product. Two entry points separated by a decade. Radically different outcomes - not because of anything the investor did, but because of when they started.
That is the central tension in holding TQQQ for the long term. The product has an extraordinary verified track record since inception. It also has a structural fragility that does not appear in that track record, because the fund has never traded through a sustained bear market that matches the severity and duration of 2000-2002. Understanding both realities - not just the one that shows up in the headline CAGR - is the prerequisite for any serious decision about whether, how much, and for how long to hold it.
The Verified Track Record
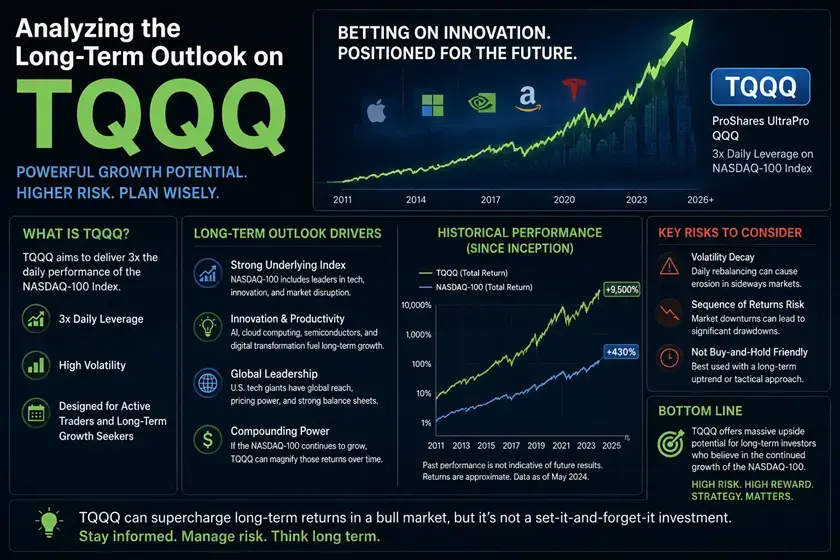
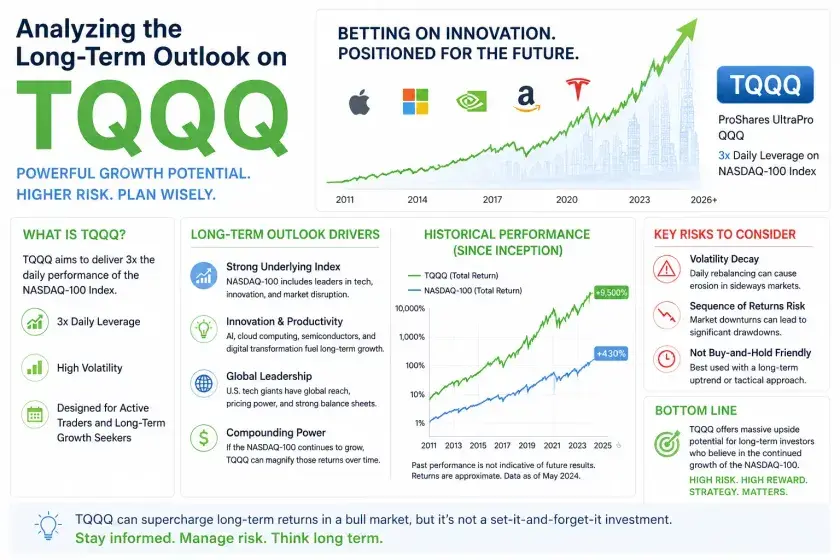
TQQQ launched on February 9, 2010. What has happened since is genuinely remarkable.
From inception through May 26, 2026, TQQQ has compounded at 44.38% per year in nominal total return terms - or 39.69% per year in real, inflation-adjusted terms - according to TotalRealReturns.com data. A $10,000 investment at launch is worth over $3.95 million in nominal terms today. No major asset class, no hedge fund index, no other widely accessible ETF has come close to that number over the same period.
The annual breakdown tells a more complete story:
| Year | TQQQ | QQQ |
|---|---|---|
| 2019 | +133.83% | +39.0% |
| 2020 | +110.05% | +48.6% |
| 2021 | +82.98% | +27.4% |
| 2022 | -79.09% | -32.6% |
| 2023 | +198.26% | +54.9% |
| 2024 | +58.23% | +25.6% |
| 2025 | +34.37% | +17.5% |
| YTD 2026 | +55.17% | ~16.9% |
Source: Yahoo Finance, TotalRealReturns.com (as of May 26, 2026)
The dollar comparison makes the divergence between leverage and no leverage concrete. A $10,000 investment in TQQQ at launch in February 2010 is worth approximately $3.95 million today. The same $10,000 in QQQ over the same period - with QQQ compounding at 21.60% annually - would be worth approximately $232,000. Both outcomes are exceptional by any historical standard. The gap between them is the compounding effect of leverage in a bull market, and it is why the product attracts so much attention.
The asymmetry in both directions is the defining feature of the data. In 2023, TQQQ delivered 198% when QQQ delivered 55% - that is not 3x the index return, it is 3.6x, because compounding in a trending market amplifies gains beyond the theoretical multiple. In 2022, the gap worked in the other direction: QQQ fell 32.6%, TQQQ fell 79.1% - that is 2.4x the underlying loss, not exactly 3x, because daily compounding also compresses losses relative to the leveraged multiple when the market falls steadily over a sustained period rather than in a single sharp drop.
The rolling return data from MyPlanIQ, covering the full life of the fund, is worth knowing precisely. The worst 3-year rolling annualized return for TQQQ since inception is -7.03%. The worst 5-year rolling return is +8.55%. The worst 10-year rolling return is +28.91%. Every 10-year holding period in TQQQ’s history - and there are only a handful of them, since the fund is 16 years old - has been enormously positive, with the worst case still delivering almost 29% per year compounded.
These are real numbers, not simulations, and they are striking. But they come with a caveat that the fund’s own documentation does not resolve: every single day of TQQQ’s existence has occurred during a period of broadly rising equity markets, interrupted by two sharp but ultimately short drawdowns (2020 COVID and 2022 rate cycle). The fund has never traded through what it would have experienced in 2000-2002.
The Problem the Track Record Doesn’t Show
TQQQ did not exist during the dot-com crash. QQQ did. From March 2000 to October 2002, QQQ fell 83%. It did not recover to its March 2000 price until August 2016 - sixteen years later.
When researchers simulate what a 3x leveraged Nasdaq ETF would have done through that same period, the numbers are sobering. The simulated TQQQ position from January 2000 would have approached a near-total wipeout by October 2002 - not technically zero, because daily-reset leveraged ETFs cannot go below zero due to their rebalancing mechanism, but so close to zero as to be functionally irretrievable. More importantly, the simulated recovery from that entry point never fully caught up to an unlevered QQQ position held through the same period. An investor who bought TQQQ at the January 2000 peak still has not broken even in dollar terms relative to what buying QQQ at the same point would have delivered, according to PortfolioVisualizer backtest simulations using QQQ’s daily returns to construct the hypothetical 3x series.
This is not an argument that the dot-com scenario will repeat. It is an argument that TQQQ’s historical track record is entirely drawn from a period that did not include the scenario where long-term holding can produce near-permanent capital loss. Investors who cite the 44% CAGR since inception as evidence that TQQQ is safe to hold long-term are making an implicit assumption: that the Nasdaq 100 will not experience another sustained decline of 40%+ over multiple years. That assumption may well be correct. But it is an assumption, not a fact, and recognizing it as such changes how the position should be sized and managed.
What makes 2026 different from 2010 in this respect is concentration. The Nasdaq 100 is currently more concentrated than at any point since the late 1990s. The Magnificent Seven - Apple, Microsoft, Nvidia, Amazon, Alphabet, Meta, and Tesla - account for approximately 50% or more of the index weight. A single earnings miss from one of these companies can move the entire Nasdaq 100 by 2-3% in a single session. In 2025, roughly 42% of the S&P 500’s total return came from the Magnificent Seven alone - and these companies have an average forward P/E that reflects substantial AI monetization expectations built into the price. If those expectations disappoint over a multi-year period, the mechanism for a severe and prolonged Nasdaq drawdown exists.
None of this means it will happen. The same concentration that creates downside risk also creates upside momentum when the dominant stocks are growing - exactly the dynamic that has made TQQQ’s returns so extraordinary since 2010. The point is to hold the upside case and the downside case in mind simultaneously, not to let the recent track record crowd out the historical stress test that TQQQ has never actually lived through.
What the Risk Numbers Actually Say
Beyond the return history, several statistics give a clear picture of what holding TQQQ involves.
Maximum drawdown: 81.7%, occurring on December 28, 2022. Recovery required 486 trading sessions - roughly two years of uninterrupted holding after the bottom. An investor who entered at TQQQ’s late 2021 peak and panicked at the December 2022 low would have permanently locked in an 82% loss. The recovery was available only to those who held through the entire period without selling.
Annualized standard deviation: 61.5% over TQQQ’s life. For comparison, the S&P 500’s long-run standard deviation is approximately 15-17%. TQQQ is roughly four times as volatile as the broad market. In practical terms, this means double-digit daily swings during periods of market stress are normal for this product, not exceptional. The best single day on record was April 9, 2025 at +35.2%; the worst was March 16, 2020 at -34.5%.
Sharpe Ratio: 0.68 since inception. This is a moderate risk-adjusted return - positive, meaning the fund has compensated investors for its volatility, but not exceptional. For context, QQQ’s Sharpe Ratio over the same period is approximately 0.82, meaning QQQ has delivered better risk-adjusted returns than TQQQ despite substantially lower total returns. The higher absolute return of TQQQ has come with more than proportionally higher volatility.
Capture ratio: 565.79% upside / 225.01% downside versus the S&P 500. TQQQ amplifies S&P 500 gains by 5.66x but amplifies losses by only 2.25x. This asymmetry is a mathematical consequence of compounding in a market that has trended upward more than downward since 2010 - and it is the primary reason the total return has been so extraordinary. But this asymmetry is path-dependent, not permanent. In a different market regime - sideways, volatile, or persistently down - the ratio would look very different.
The Nasdaq 100 as the Foundation Bet
Holding TQQQ long-term is, at its core, a highly leveraged bet on a specific version of the future: that the Nasdaq 100, as currently constructed, will continue to compound at rates that more than offset volatility decay over time.
That is a reasonable bet with a solid historical basis. The Nasdaq 100 has delivered approximately 13-14% annualized over 30 years (QQQ inception to present), making it one of the strongest performing major equity indices globally. The companies that dominate it today - Microsoft, Nvidia, Apple, Amazon, Alphabet, Meta - have real earnings, real cash flows, and genuine competitive advantages that the dot-com era companies largely lacked. This is not 1999. The Magnificent Seven collectively have fortress balance sheets that would-be bubble analogists sometimes overlook.
But the Nasdaq 100’s construction has structural features that create concentration risk that is real and measurable. As of 2026, the top seven holdings represent over half the index weight. The average Nasdaq 100 company is more than twice as sensitive to interest rate changes as the average S&P 500 company, because growth company valuations reflect future earnings discounted at a long time horizon - the same mathematical sensitivity to discount rates that made 2022 so severe. With the 10-year Treasury yield hovering around 4.5% and the Fed having signaled rates will remain elevated while inflation stays above target, this sensitivity remains in the portfolio.
The structural bull case is equally valid. AI infrastructure spending among the hyperscalers is running at levels that, historically, have preceded multi-year productivity boosts rather than valuation collapses. Microsoft’s Azure, Google Cloud, and AWS are growing double-digits annually with expanding margins. Nvidia’s data center revenue has grown faster than almost any large-cap in history. The question is whether current prices have already priced in those outcomes - and that is a question the market itself has not resolved.
For TQQQ, this translates to a simple dependency: the product performs extraordinarily if the Nasdaq 100 trends upward over the holding period. It performs catastrophically if the Nasdaq 100 enters a multi-year drawdown similar to 2000-2002. The range of outcomes is genuinely extreme in both directions, which is why position size matters more for this product than for almost anything else in a portfolio.
The Rolling Return Perspective
One of the more useful ways to think about TQQQ is through rolling returns - the annualized return for every possible start and end date combination over a defined holding period.
From MyPlanIQ’s analysis covering TQQQ’s full history through May 2026:
| Holding Period | Worst Rolling Return | Best Rolling Return |
|---|---|---|
| 3 years | -7.03% per year | (exceptional during bull periods) |
| 5 years | +8.55% per year | well above 50% |
| 10 years | +28.91% per year | above 50% |
The critical insight from these numbers: there has been no 5-year period in TQQQ’s actual history where an investor lost money. The worst 5-year outcome was a gain of +8.55% annually. The worst 3-year outcome was a loss of -7.03% annually - painful but not ruinous, and it would have required starting right before 2022 and exiting at the bottom.
The honest caveat: TQQQ’s history is only 16 years long, and all of it has been in a broadly constructive market environment. The rolling return floor of +8.55% over 5 years does not mean that is the worst possible 5-year outcome - it means it is the worst that has occurred so far. A hypothetical 5-year period beginning in 2000 would have produced a deeply negative result for a simulated TQQQ position.
US Estate Tax Exposure for International Investors
TQQQ is a US-domiciled ETF and is a US-situs asset for estate tax purposes. Non-US persons holding TQQQ face potential US estate tax on the full value above a $60,000 threshold, at rates up to 40%, unless covered by a relevant estate tax treaty between their country and the United States.
For a product that compounds at 44% per year, a position of any meaningful starting size can grow to estate-tax-relevant levels relatively quickly. An investor who puts $50,000 into TQQQ and holds for 10 years - even at the worst historical 10-year rolling return of +28.91% per year - would have approximately $725,000 in a decade, well inside estate tax territory for non-treaty investors.
There is no Irish UCITS equivalent for 3x leveraged Nasdaq ETFs. EU UCITS regulations cap leverage at 2x for retail-eligible products, meaning the 3x exposure that drives TQQQ’s extraordinary return profile is simply not available in a non-US domiciled format. Non-US investors who want TQQQ-level leverage either accept the estate tax exposure or do without the 3x product. That trade-off belongs in any honest analysis of long-term TQQQ holding for internationally mobile investors.
Who Should Hold TQQQ Long-Term
This is not a question with a universal answer, but the available data points toward a clear framework.
The case for a long-term TQQQ position is strongest for investors who have a genuine multi-decade time horizon, hold the position as a meaningful but not dominant portion of a broader portfolio (rather than 100% of their investable assets), have the documented psychological capacity to hold through an 80%+ drawdown without panic-selling, and have a clear exit plan or rebalancing rule defined before the position is open. For this investor, the verified 44% CAGR and the rolling return floor of +8.55% over any 5-year period in the product’s history represent a compelling case.
The case weakens substantially for investors who have a 5-10 year horizon that could coincide with a severe and sustained Nasdaq drawdown at the wrong time, are holding TQQQ as 50%+ of their investable assets, are relying on the recent 16-year track record without accounting for the simulation data from 2000-2002, or have not stress-tested their emotional tolerance for the volatility numbers: 61.5% annual standard deviation, -81.7% maximum drawdown, 30%+ single-month losses.
The middle ground - a 5-15% allocation to TQQQ within a diversified portfolio, held with a predefined rebalancing rule - captures most of the asymmetric upside while keeping the worst-case drawdown impact on the overall portfolio manageable. An investor with $500,000 who holds 10% in TQQQ and 90% in a diversified equity/bond portfolio experiences an 82% TQQQ drawdown as an 8.2% hit to total portfolio value. The same investor with 60% in TQQQ experiences that drawdown as a 49% loss to total portfolio value - a number that historically triggers panic selling near lows.
Position size is not a function of confidence in the Nasdaq. It is a function of what loss you can tolerate without selling.
The Entry Point Question
One of the most common questions about TQQQ - and the most honest one - is whether the current level is a good entry point. The verified performance since inception suggests that virtually any entry point in TQQQ’s history has been a good one, provided the holding period was long enough. But that history is all drawn from a market that broadly rose over the period.
The more useful question is whether today’s Nasdaq 100 is priced to deliver the kind of long-term returns that TQQQ’s compounding mechanism requires to generate positive real outcomes over a full decade. With the Nasdaq 100 trailing PE ratio at 36.49 (GuruFocus, May 27, 2026) - sitting at the 99.2th percentile of the past decade’s valuation range - AI spending expected to exceed global military spending by 2027, and the Magnificent Seven still commanding over 50% of the index weight, the index is priced for a scenario where AI monetization proceeds at scale. That scenario is achievable. It is not guaranteed.
Dollar-cost averaging into TQQQ - spreading entries over 12-24 months rather than committing a lump sum - reduces the timing risk associated with entering at or near a valuation peak. Combined with a clear rebalancing rule (as covered in our leveraged ETF rebalancing guide), it is the most straightforward way to build a long-term TQQQ position without betting everything on a single entry date.
The Bottom Line
TQQQ’s 16-year track record is one of the most extraordinary in ETF history - 44.38% CAGR, +39,526% total nominal return, worst 5-year rolling return of +8.55%, worst 10-year rolling return of +28.91%. These are verified numbers from a real product that real investors have held through real market cycles including 2020 and 2022.
The limitation of that record is equally real: it covers only 16 years, all of them in a broadly constructive market environment, and it excludes the scenario - illustrated by simulation data from 2000-2002 - where a sustained Nasdaq bear market produces outcomes that TQQQ may never recover from for investors at the wrong entry point. That scenario has not occurred in TQQQ’s lifetime. The structural conditions for it to occur - high concentration, elevated valuations, rate sensitivity - are present in today’s market even if they do not guarantee that outcome.
The long-term case for TQQQ rests on one foundational assumption: that the Nasdaq 100 will continue to trend upward over the next decade at rates sufficient to generate real wealth after volatility decay. The history of the past 30 years supports that assumption. So does the genuine revenue growth, cash flow generation, and competitive positioning of the companies that now dominate the index.
Holding TQQQ long-term is not irrational. Holding it without understanding what it requires - the capacity to absorb 80% drawdowns without selling, a position size calibrated to that reality, and a clear framework for entry, rebalancing, and exit - is.
This article is for informational purposes only and does not constitute investment advice. Leveraged ETFs are complex instruments with significant risk of capital loss. All figures reflect publicly available data as of May 2026. Past performance is not a guarantee of future results. Consult a qualified financial adviser before making investment decisions.